An 8D Report usually contains three types of actions: containment actions, corrective actions and preventive actions. Although they all look similar at first sight, there are differences. 8D Report is mostly used to solve customer complaints and other quality deviation-related problems. Photo Credits:BWJones In this post … Read More
What is an 8D report?
An 8D report is a structured, team-based problem-solving document used in manufacturing and quality management to identify the root causes of defects or failures, implement permanent corrective actions, and prevent recurrence. Developed by Ford Motor Company in 1987, the 8D process follows eight disciplines (D0 through D8) — from assembling a cross-functional team and describing the problem, through root cause analysis and corrective action, to systemic prevention and team recognition.
The "8D" in the name refers to the Eight Disciplines — a sequence of structured steps that guide teams from the moment a problem is discovered to the point where it is permanently resolved and similar future problems are prevented. Some organizations include a preliminary planning step called D0, making nine steps in total.
Unlike informal problem-solving approaches, the 8D methodology is data-driven, team-oriented, and documented. The final deliverable — the 8D report itself — serves as both a communication tool (shared with customers, suppliers, and stakeholders) and a permanent record that feeds into organizational learning and continuous improvement.
Originally designed for the automotive industry, the 8D process is now used across manufacturing, aerospace, electronics, food production, pharmaceuticals, healthcare, and any sector where recurring quality problems need to be eliminated systematically.
Why it matters
An 8D report is not just a document — it is evidence that your organization follows a disciplined, fact-based approach to problem solving. For suppliers in the automotive and aerospace industries, the ability to produce rigorous 8D reports is often a contractual requirement and a key factor in customer trust.
The history behind 8D problem solving
Understanding where 8D came from helps explain why it works — and why it has endured for nearly four decades while other methodologies have faded.
1974
The U.S. Department of Defense publishes MIL-STD-1520 "Corrective Action and Disposition System for Nonconforming Material" — a 13-page standard establishing corrective actions and containment of defective items. While not the 8D process itself, MIL-STD-1520 planted the seeds for a structured approach to nonconformance management that Ford would later formalize.
1987
Ford Motor Company publishes the Team Oriented Problem Solving (TOPS) manual — a 60-page document that codifies the eight-step methodology. Developed within Ford's Powertrain Organization at their Dearborn, Michigan headquarters, TOPS was created because executives saw that design engineering, manufacturing engineering, and production teams needed to collaborate on chronic recurring problems instead of solving them in isolation.
1990s
The methodology spreads beyond Ford to the broader automotive supply chain and becomes a standard requirement from OEMs worldwide. Other industries — aerospace, electronics, and heavy manufacturing — begin adopting the process.
Late 1990s
Ford develops Global 8D (G8D), a significant revision that adds three critical elements: D0 (a planning and gateway step with Emergency Response Actions), the escape point concept across D4–D6, and formal process flowcharts with checklists. G8D becomes Ford's worldwide standard.
2000s–Today
The 8D methodology continues evolving through digital tools and integration with quality management systems (QMS). Cloud-based 8D platforms enable real-time cross-functional collaboration — even across organizations and geographies — replacing the spreadsheets and email chains that once slowed the process. Standards like IATF 16949, VDA Volume 8D, and AESQ RM13000 now reference or require 8D-based approaches.
The 9 steps of the 8D process (D0–D8)
Each discipline builds on the previous one. Skipping steps or rushing through them is the most common reason 8D reports fail to produce lasting results.

D0
D0 — Plan and Prepare
Before launching a full 8D, evaluate whether one is even necessary. D0 serves as a gateway: the team gathers initial data, assesses severity, and determines if the problem warrants the investment of a cross-functional investigation.
If the root cause is already known and the fix is straightforward, a simpler method (5 Whys, Just-Do-It) may suffice. If the problem is complex, recurring, or customer-facing, proceed to D1.
Key actions: Document the symptom, collect any available data, implement Emergency Response Actions (ERAs) to protect the customer, and complete the D0 assessment checklist.
ERA Worksheet
D0 Gateway Checklist
Initial Data Collection
D1
D1 — Establish the Team
Form a cross-functional team of 4–8 people who collectively possess the product knowledge, process expertise, authority to act, and the time to commit. The team should include representatives from all functions that touch the problem — not just quality.
Assign two key roles: a Team Leader (who facilitates the process and authors the 8D report) and a Champion (a manager or executive with authority to remove obstacles and allocate resources).
Practical tip
Include someone from outside the immediate problem area. Fresh eyes catch assumptions that insiders overlook. Also, define team rules upfront — meeting cadence, decision-making process, and who communicates externally. Teams that skip this step often stall due to confusion about roles.
Team Charter
RACI Matrix
Skills Matrix
D2
D2 — Describe the Problem
A precise problem description is the foundation of everything that follows. Use the 5W2H method to quantify and scope the problem:
- Who — is affected? Who discovered it?
- What — is the defect or failure? What object/part is concerned?
- Where — in the process does it occur? Where geographically?
- When — was it first discovered? When in the process cycle?
- Why — is it a problem? (Impact on customer/process)
- How — does the defect manifest?
- How many — parts/units are affected? What is the defect rate?
Then apply the Is/Is Not analysis to sharpen the definition: compare what the problem IS against what it IS NOT. For example: "The defect appears on Line 3 (IS) but not on Line 4 (IS NOT), despite identical tooling." This narrows the investigation scope dramatically.
Common pitfall
Vague problem descriptions like "product quality issue" or "customer complaint" doom the 8D from the start. If you cannot quantify the problem (defect rate, rejection count, dimensional deviation), stop and collect data before proceeding.
5W2H Analysis
Is / Is Not Worksheet
Trend Charts
D3
D3 — Implement Interim Containment Actions (ICA)
Containment protects the customer immediately while the team investigates root causes. This is not a permanent fix — it is a firewall. Typical containment actions include sorting and screening suspect inventory, adding temporary inspection steps, quarantining affected lots, or switching to a known-good alternative.
Critical: verify that containment works. Check that the action actually stops defective product from reaching the customer. Monitor for unintended side effects. Document the containment action, its scope, and the verification data.
In automotive, Tier-1 suppliers are typically expected to have containment in place within 24 hours of receiving a complaint.
Containment Verification
Sort & Inspect Plans
Inventory Quarantine
D4
D4 — Root Cause Analysis and Escape Point
This is the most analytically demanding discipline — and where most 8D reports succeed or fail. The goal is twofold: identify the occurrence root cause (why did the defect happen?) and the escape point (why did existing controls fail to detect it?).
Occurrence root cause analysis typically uses:
- 5 Whys — Keep asking "why" until you reach a systemic cause (typically 5 iterations, but use as many as needed)
- Ishikawa (fishbone) diagram — Map possible causes across categories: Man, Machine, Method, Material, Measurement, Environment
- Fault Tree Analysis — For complex failure chains with multiple contributing factors
Escape point analysis — introduced in Ford's Global 8D — requires the team to trace the process flow from the root cause forward, identifying every inspection, test, or control point the defect passed through, and pinpointing where detection should have occurred but did not.
The escape point concept
An escape point is the earliest control point in the process — after the root cause location — that should have detected the problem but failed to do so. Addressing escape points is what separates rigorous 8D from surface-level problem solving. You fix both why it happened and why you didn't catch it.
Verify the root cause. A root cause is not confirmed until you can demonstrate that it explains all known data — including the Is/Is Not results from D2. Can you turn the defect on and off by introducing and removing the root cause? If not, keep investigating.
5 Whys
Ishikawa Diagram
Fault Tree Analysis
Is / Is Not Verification
Escape Point Map

D5
D5 — Choose and Verify Permanent Corrective Actions (PCA)
Develop permanent solutions that address both the occurrence root cause and the escape point. Brainstorm multiple options, then evaluate each against criteria: effectiveness, feasibility, cost, implementation time, and risk of unintended consequences.
Verify before implementing. Use controlled tests, pilot runs, or simulations to confirm that the chosen corrective action actually eliminates the root cause — without creating new problems. This verification step is what distinguishes D5 from D6.
Decision Matrix
Pilot Testing
Risk Assessment
D6
D6 — Implement and Validate Corrective Actions
Roll out the verified corrective actions, remove the interim containment measures from D3, and validate effectiveness with production data. This means monitoring the process over a defined period (not just a single run) to confirm the problem does not recur.
Update all affected documentation: work instructions, control plans, inspection criteria, and training materials.
Implementation Plan
SPC Charts
Effectiveness Monitoring
D7
D7 — Prevent Recurrence
This discipline elevates 8D from reactive problem-solving to systemic improvement. Ask: "What weakness in our management systems allowed this problem to exist in the first place?"
Actions in D7 typically include updating FMEA documents with the newly identified failure mode, modifying design or process standards, rolling out lessons learned to similar products or processes, and updating training programs. This is also where you consider whether the same root cause could exist elsewhere — in a different product line, a different plant, or a different supplier.
FMEA Update
Control Plan Revision
Lessons Learned Database
Horizontal Deployment
D8
D8 — Recognize the Team
Acknowledge the collective effort. Effective 8D investigations require significant time and expertise from team members who typically have other full-time responsibilities. Recognition reinforces a culture where people want to participate in problem-solving, rather than viewing it as a burden.
Document the final 8D report, archive it for future reference, and formally close the investigation.
Tools and techniques used in each 8D step
One of the strengths of the 8D methodology is that it integrates proven analytical tools at specific points in the process. Here is a quick-reference guide:
| 8D Step | Primary Tool | Purpose |
|---|---|---|
| D0 | ERA Worksheet, Gateway Checklist | Assess severity, decide whether full 8D is warranted |
| D1 | Skills Matrix, RACI Chart | Assemble the right team with clear roles |
| D2 | 5W2H, Is / Is Not Analysis | Quantify and scope the problem precisely |
| D3 | Sort Plans, Quarantine Logs | Protect the customer while investigating |
| D4 | 5 Whys, Ishikawa, Fault Tree | Identify and verify occurrence cause and escape point |
| D5 | Decision Matrix, Pilot Runs | Select and verify the best permanent fix |
| D6 | SPC Charts, Cpk Analysis | Validate effectiveness with production data |
| D7 | FMEA, Control Plan Updates | Prevent recurrence systemically |
| D8 | Lessons Learned Log | Document, archive, and recognize the team |
8D report example — a filled-in walkthrough
Finding real, complete 8D report examples is surprisingly difficult. Most resources offer blank templates without showing what a properly completed report looks like. Here is a realistic walkthrough based on a common manufacturing scenario:
Scenario
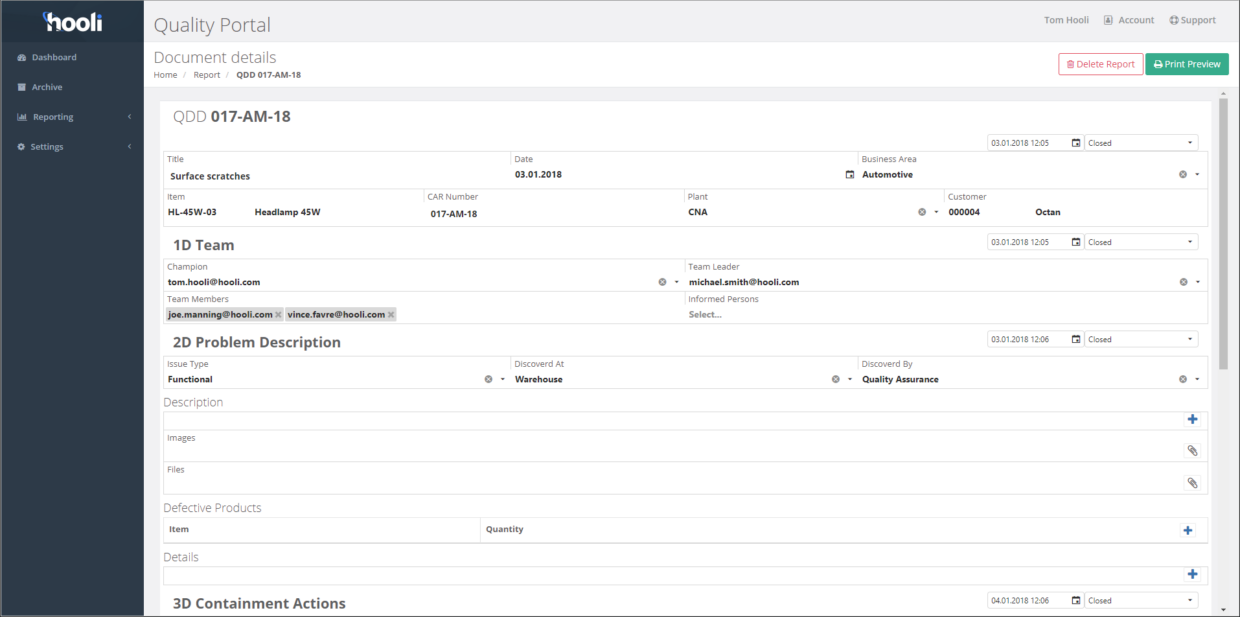
Problem: A Tier-2 automotive supplier receives a customer complaint: 2.3% of stamped steel brackets in a shipment of 5,000 have a dimensional deviation (hole position out of tolerance by 0.4mm), causing assembly interference at the customer's plant.
D0 — Plan: ERA taken: suspect inventory held. Assessment confirms this is a recurring issue (third complaint in 6 months) with unknown root cause — full 8D is warranted.
D1 — Team: Quality Engineer (Lead), Stamping Process Engineer, Tool & Die Technician, Production Supervisor, SPC Analyst. Champion: Plant Quality Manager.
D2 — Problem Description: Hole position on Part #BR-4521 is out of tolerance (nominal ±0.2mm, actual deviation up to +0.4mm). Affects hole #3 only (IS), not holes #1 or #2 (IS NOT). Occurs on Press Line 2 (IS), not Press Line 1 (IS NOT). First detected on Feb 15 lot; also found on Feb 8 lot. Defect rate: 2.3% (115 of 5,000 pieces).
D3 — Containment: 100% dimensional inspection of all in-stock and in-transit inventory for Part #BR-4521. Affected lots quarantined. Known-good stock expedited to customer. Containment verified: zero defective parts shipped after implementation.
D4 — Root Cause: Using 5 Whys on the Is/Is Not data (Line 2 but not Line 1; hole #3 but not #1 or #2): the locating pin for hole #3 on the Press Line 2 die showed 0.3mm wear, causing the blank to shift during the piercing operation. Escape point: The in-process SPC check only sampled hole #1 — hole #3 was not in the SPC sampling plan.
D5 — Corrective Actions Chosen: (1) Replace worn locating pin and implement preventive maintenance schedule with pin wear measurement every 50,000 cycles. (2) Add hole #3 to the SPC sampling plan.
D6 — Validation: After pin replacement, 3 consecutive production runs (15,000 parts) produced zero defects on hole #3. Cpk improved from 0.85 to 1.67. Containment measures removed.
D7 — Prevention: FMEA updated with new failure mode "locating pin wear." PM schedule applied to all similar dies across both press lines. SPC sampling plans reviewed and updated for all bracket parts to include all critical hole positions.
D8 — Recognition: Team acknowledged at plant quality meeting. Lessons learned documented and shared with sister plant.
8D vs A3 vs DMAIC vs CAPA — choosing the right method
The 8D methodology is not the only structured problem-solving approach. Understanding when to use each method — and how they relate — prevents wasted effort and ensures the right level of rigor for each situation.
| Criteria | 8D | A3 (Toyota) | DMAIC (Six Sigma) | CAPA |
|---|---|---|---|---|
| Origin | Ford (1987) | Toyota (1960s) | Motorola/GE (1980s–90s) | FDA / ISO regulations |
| Format | Structured report (D0–D8) | Single A3-sized page | 5-phase project (Define–Control) | Documented corrective/preventive actions |
| Team size | 4–8 cross-functional | 1–3 people | 5–10 with Black Belt lead | Varies by regulation |
| Typical duration | 2–6 weeks | 1–2 weeks | 3–6 months | 30–90 days (regulated) |
| Best for | Complex, recurring quality problems with unknown root cause | Smaller-scope problems; visual communication | Process variation reduction with statistical rigor | Regulatory compliance (FDA, ISO) |
| Containment step? | Yes (D3) | No formal step | No formal step | Sometimes |
| Escape point analysis? | Yes (D4–D6 in G8D) | No | No | No |
| Statistical depth | Moderate | Low | High (hypothesis testing, DOE) | Low–Moderate |
| Strength | Customer containment + root cause rigor | Brevity and visual clarity | Data-driven precision | Regulatory traceability |
Key insight
8D and CAPA are not the same thing, although they are often confused. CAPA (Corrective Action / Preventive Action) is a regulatory requirement under FDA 21 CFR 820.100 and ISO 13485. 8D is a methodology that can fulfill CAPA requirements — but with an important difference: standard 8D places corrective action verification before implementation (D5 verifies, D6 implements), while FDA/ISO regulations require effectiveness verification after implementation. Organizations in pharma and medical devices must adapt the 8D process to add post-implementation verification.
When should you use 8D? (And when you shouldn't)
Use 8D when:
- A customer complaint requires a formal, documented response with containment actions
- A defect or failure is recurring and previous attempts to fix it have not worked
- The root cause is unknown and requires cross-functional investigation
- The problem affects multiple departments, processes, or locations
- There is a safety or regulatory concern that demands rigorous traceability
- Your customer or OEM contractually requires 8D reporting (common in automotive and aerospace)
Don't use 8D when:
- The root cause is already known and the fix is straightforward — use a Just-Do-It approach instead
- The problem is a one-time occurrence with no recurrence risk
- A single person can resolve it without cross-functional input — consider 5 Whys or A3
- The problem requires deep statistical analysis with designed experiments — use DMAIC instead
- You need the paperwork but not the process — an 8D done as a checkbox exercise produces no value
Industry-specific 8D applications
Automotive (IATF 16949)
8D is the de facto standard for supplier corrective actions in the automotive industry. IATF 16949 (the automotive quality management standard) requires systematic problem-solving approaches, and most OEMs (Ford, GM, Volkswagen, Toyota, BMW) explicitly require 8D reports from suppliers when quality issues arise. The VDA Volume 8D provides a German automotive association standard for 8D reporting that is widely used in European supply chains.
Typical requirements: Initial containment within 24 hours, corrective actions defined within 5–7 working days, full closure within 30 calendar days.
Aerospace (AS9100)
In aerospace, 8D integrates with the AS9100 quality management standard and its requirements for configuration management and first-article inspection. The stakes are exceptionally high — defects can have life-safety implications — so 8D reports in aerospace tend to be more detailed, with stricter evidence requirements and longer validation periods.
Pharmaceutical & Medical Devices (FDA)
8D is increasingly used as the methodology behind CAPA systems in FDA-regulated industries. However, as noted above, organizations must adapt the standard 8D flow to satisfy FDA 21 CFR Part 820.100 requirements — particularly the need for effectiveness verification after implementation and documentation that supports audit traceability.
Food Manufacturing (HACCP / FSSC 22000)
Food manufacturers use 8D to investigate contamination events, foreign body complaints, and process deviations. The methodology maps well onto HACCP principles — both emphasize systematic root cause identification and preventive controls. Containment actions (D3) are especially critical in food, where product recalls carry significant financial and reputational risk.
10 common mistakes that derail 8D reports
After years of working with teams on 8D processes, these are the patterns we see most frequently. Each one can be avoided with awareness and discipline.
Treating 8D as paperwork instead of problem-solving
Teams rush through the form to satisfy a customer requirement, filling in boxes without doing the actual analytical work. The result: a document that looks complete but addresses symptoms, not root causes.
Fix: Judge 8D reports by whether the problem recurs — not by how quickly the form was submitted.
Vague problem descriptions
"Customer complaint about quality" tells you nothing. Without quantified data, the team has no basis for root cause analysis.
Fix: Require 5W2H completion before proceeding past D2. If you can't quantify the defect, you are not ready for D4.
Confusing containment (D3) with correction (D5/D6)
Some teams implement containment and declare the problem solved. But containment is a temporary shield — the root cause is still active.
Fix: Containment must always be followed by permanent corrective actions. Never close an 8D at D3.
Stopping 5 Whys too early
The team asks "why" two or three times, arrives at a proximate cause, and stops. The real systemic root cause remains untouched.
Fix: Keep going until you reach a cause that, if removed, would prevent the problem from occurring. This often requires 5–7 iterations.
Ignoring the escape point
Teams fix the occurrence cause but never ask why the control system didn't catch the defect. The same problem escapes through the same gap again — just from a different cause.
Fix: Make escape point analysis mandatory in every 8D. Address both "why did it happen?" and "why didn't we catch it?"
Wrong team composition
The team lacks process knowledge, excludes shop floor operators who see the problem daily, or consists of only quality staff.
Fix: Include at least one person from the process where the defect occurs, one from quality, and one with design/engineering knowledge.
No verification of root cause
The team hypothesizes a root cause and jumps to corrective actions without verifying it — resulting in "fixes" that don't actually fix anything.
Fix: Verify by demonstrating you can reproduce the defect by introducing the cause and eliminate it by removing the cause.
Skipping D7 (prevention of recurrence)
Once D6 is validated, teams celebrate and move on — without updating FMEA, control plans, or procedures. The system stays vulnerable to similar problems.
Fix: Make D7 a mandatory checkpoint: no 8D can close without documented systemic changes and horizontal deployment.
Evidence scattered across emails and spreadsheets
Data, photos, test results, and meeting notes live in different people's inboxes. When a customer or auditor asks for evidence, the team scrambles to assemble it.
Fix: Use a centralized 8D platform where all evidence — files, discussions, and actions — is attached to the report itself.
No effectiveness follow-up
The corrective action is implemented, the report is closed, and nobody checks whether the problem actually stayed solved 3 months later.
Fix: Build a 60–90 day effectiveness review into every 8D. Reopen if the problem recurs.
How to measure 8D effectiveness
Most organizations track whether 8D reports were completed on time, but few measure whether they actually worked. Here are the metrics that matter:
Recurrence Rate
< 5%
Target: same problem should not return
Cycle Time
≤ 30 days
From complaint to validated closure
Completion Rate
> 90%
% of 8Ds fully completed (not stalled)
Containment Speed
< 24 hrs
Time to protect the customer
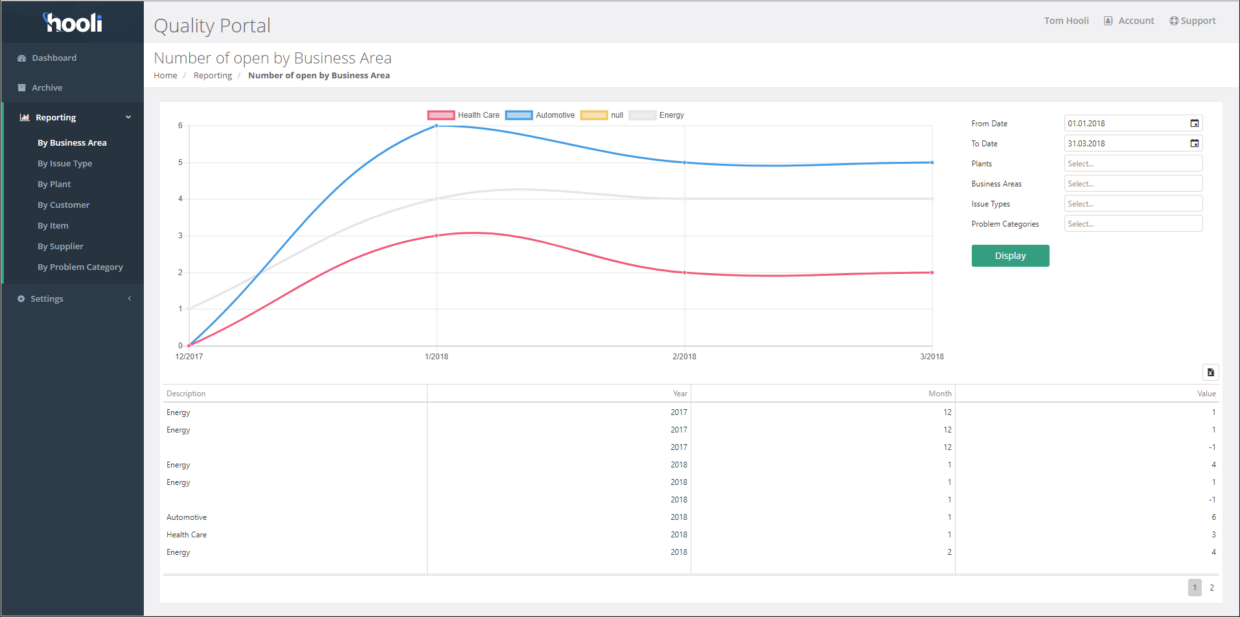
Additional metrics to track: cost of quality reduction (scrap + warranty + rework), number of corrective actions deployed horizontally (D7), customer satisfaction scores related to complaint handling, and internal PPM (parts per million defective) trends over time.
Why 8D software beats spreadsheets and email
The 8D methodology was designed for team collaboration — but many organizations still manage it with Excel templates emailed back and forth. This creates fundamental problems:
- Version control chaos. Which version of the 8D is current? Who edited what? Spreadsheets can't answer this reliably.
- Evidence fragmentation. Photos, test data, and meeting notes scatter across inboxes and shared drives. Auditors and customers can't find what they need.
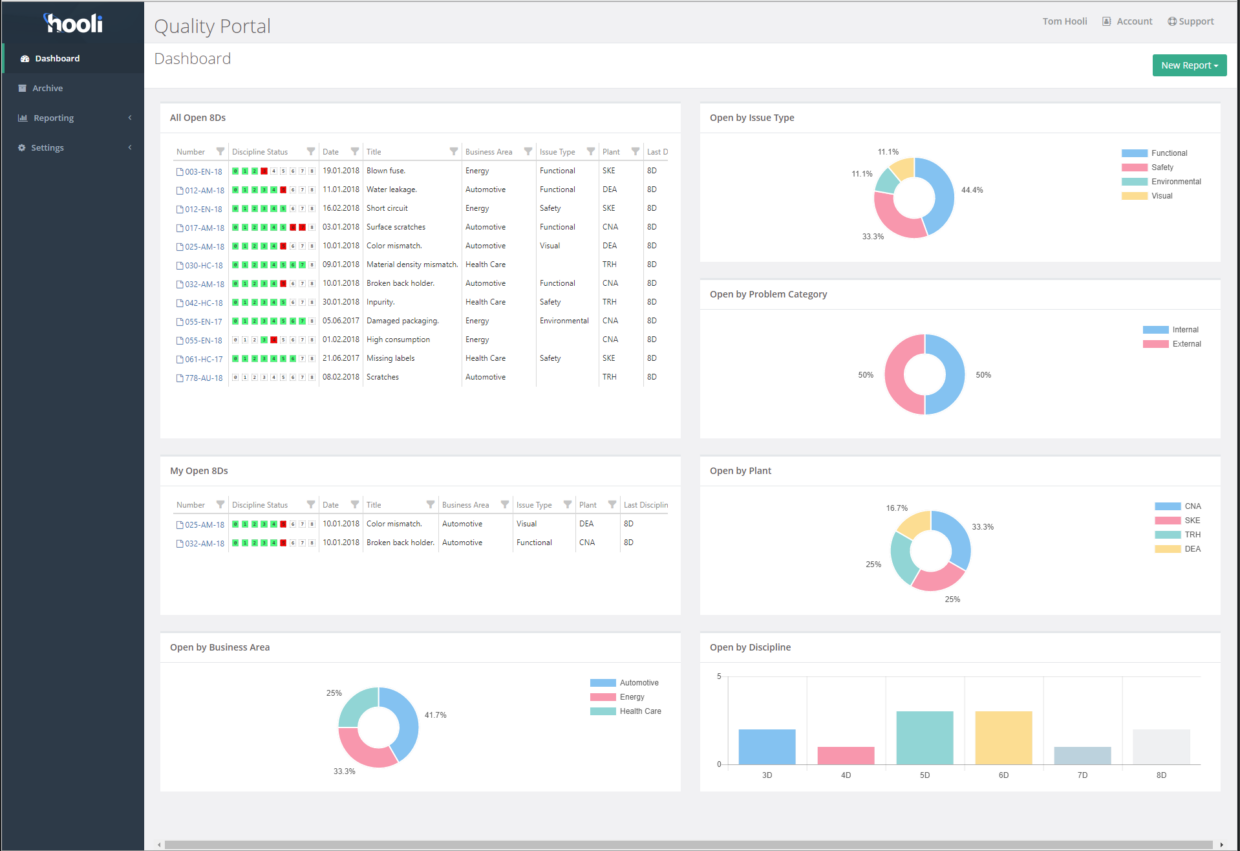
- No real-time visibility. Managers have no dashboard showing how many 8Ds are open, which are overdue, and where bottlenecks exist.
- Collaboration friction. When your team includes external suppliers or customers, sending files back and forth creates delays and miscommunication.
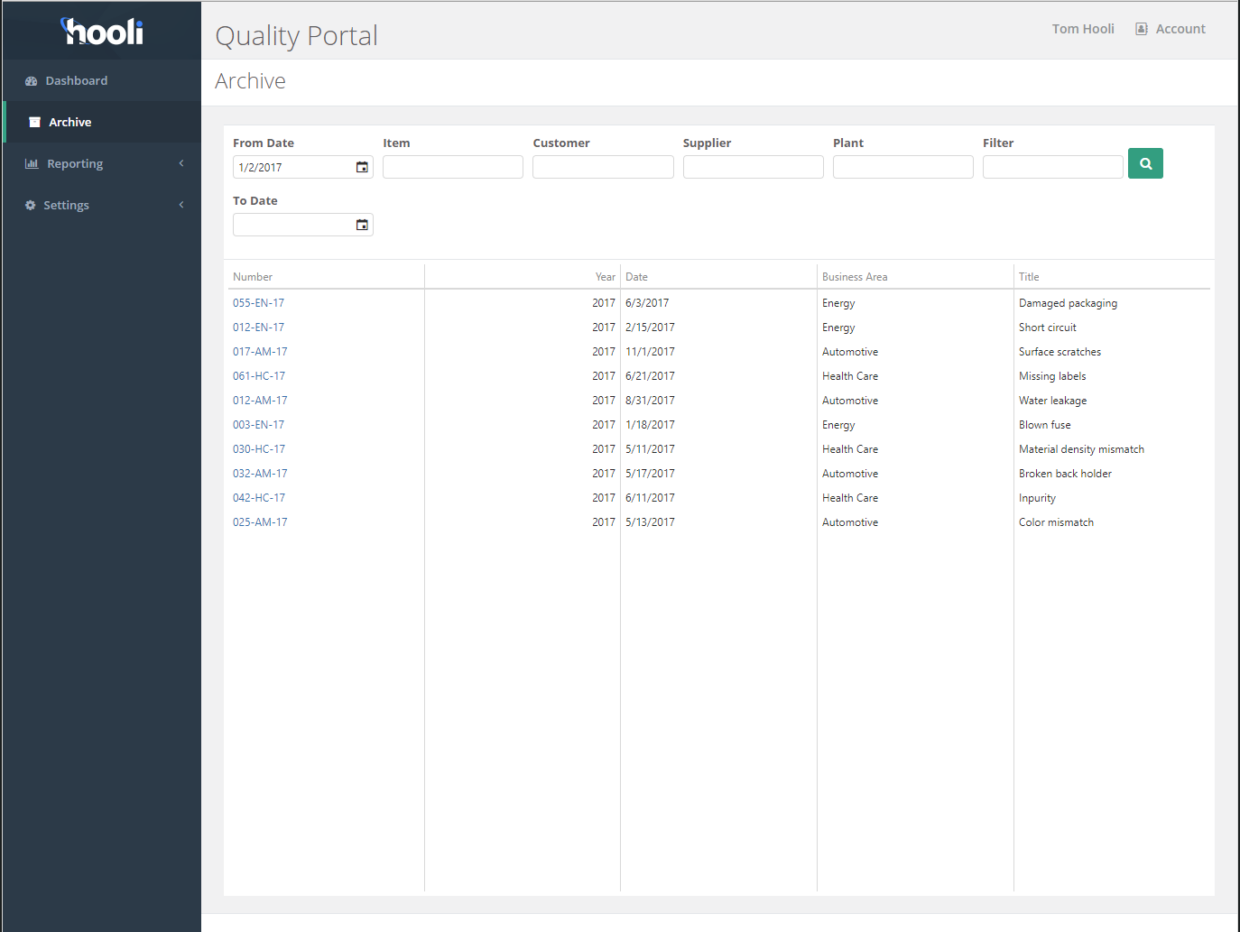
- No institutional memory. When a similar problem appears months later, nobody can find the original 8D — or the lessons it captured.
A cloud-based 8D platform solves all of these by providing a single shared workspace where the entire team (including external collaborators) can work together in real time, with version history, file management, notifications, and reporting built in.
Ready to modernize your 8D process?
Promigra 8DReport.com brings your team together in a cloud-based workspace built specifically for 8D problem solving. Collaborate, track progress, and close reports faster.
Start Your Free 21-Day TrialFrequently asked questions about 8D reports
What does 8D stand for?
8D stands for Eight Disciplines — a structured, team-based methodology for identifying root causes of problems and implementing permanent corrective actions. Developed by Ford Motor Company in 1987, it consists of steps D0 through D8.
What is the difference between 8D and A3?
8D is a team-driven methodology requiring cross-functional collaboration, typically used for complex problems with unknown root causes. A3 (from Toyota) is a leaner, single-page approach suited to smaller-scope problems that one or two people can address. 8D emphasizes containment actions and escape point analysis, while A3 focuses on concise visual storytelling of the problem-solving journey.
How long should an 8D report take to complete?
Timelines depend on problem complexity and industry requirements. In automotive, Tier-1 suppliers typically must submit initial containment actions within 24 hours, root cause analysis within 5–7 working days, and full 8D closure within 30 calendar days. Simpler problems may close in 1–2 weeks, while systemic issues involving multiple sites can take 60–90 days.
When should you NOT use 8D?
8D is overkill when the root cause is already known and a fix is straightforward, when the problem is a one-time occurrence with no recurrence risk, when a single person can resolve it without cross-functional input, or when a simpler method like 5 Whys or Just-Do-It would suffice. Reserve 8D for complex, recurring, or high-impact problems where the root cause is unknown.
What is an escape point in 8D?
An escape point is the earliest control point in a process — after the root cause — that should have detected the defect but failed to do so. Introduced by Ford in the Global 8D (G8D) revision of the late 1990s, escape point analysis requires teams to address not only why the problem occurred, but why existing controls did not catch it. This dual approach is what distinguishes rigorous 8D from surface-level problem solving.
What tools are commonly used in the 8D process?
Key tools include: Is/Is Not analysis (D2 — problem description), Ishikawa (fishbone) diagrams and 5 Whys (D4 — root cause analysis), Pareto charts (prioritizing causes), Fault Tree Analysis (complex failure chains), FMEA (preventive risk analysis in D7), and statistical process control (SPC) charts for verification in D5/D6.
Is 8D the same as CAPA?
No. CAPA (Corrective and Preventive Action) is a regulatory requirement under FDA 21 CFR 820.100 and ISO 13485. 8D is a methodology that can fulfill CAPA requirements, but they are not identical. A key difference: standard 8D verifies corrective actions before implementation (D5), while FDA regulations require effectiveness verification after implementation. Organizations in regulated industries should adapt the 8D flow accordingly.
Who invented the 8D methodology?
Ford Motor Company developed the 8D methodology in 1987, publishing it in a manual called "Team Oriented Problem Solving" (TOPS). It was created within Ford's Powertrain Organization at their Dearborn, Michigan headquarters. A military precursor — MIL-STD-1520 from the U.S. Department of Defense (1974) — introduced related concepts of corrective action and containment.
Can I use 8D outside of manufacturing?
Yes. While 8D originated in automotive manufacturing, it is now used across healthcare, finance, IT service management, food production, aerospace, retail, and government. Any organization that faces complex, recurring problems benefiting from structured, team-based investigation can apply the 8D methodology.